
General
DECODING YOUR BLOOD PANEL: Your Cholesterol Panel: LDL, HDL, and Triglycerides Explained
17 November 2026

What Does a Cholesterol Panel Actually Measure?
A cholesterol blood test provides more than a single cholesterol reading. It includes several measurements of fats and fat-like substances circulating in the blood. Together, these measurements form what is known as a lipid panel. Lipids are a group of fats and fat-like substances that perform essential functions in the body.
Cholesterol is one of these substances. It is a waxy, fat-like material found in every cell of your body. Cholesterol helps maintain cell structure and is involved in several essential biological processes. For example, the liver uses cholesterol to produce bile acids, substances that help your body digest fats. Most cholesterol is produced by the body itself, primarily in the liver, although some also comes from food.
Triglycerides are another type of lipid. They are fats that serve as an important source of energy for the body and a means of storing energy for later use. Unlike cholesterol, which primarily serves structural and other biological functions, triglycerides play a central role in energy metabolism. Despite their different roles, cholesterol and triglycerides share an important characteristic: neither dissolve easily in blood.
To travel through the water-based environment of the bloodstream, these substances are packaged into particles called lipoproteins. These particles transport cholesterol and triglycerides between different tissues and organs. Two important types are low-density lipoproteins (LDL) and high-density lipoproteins (HDL). Although both transport cholesterol, they have different roles in how the body handles it.
The distinction between these carriers is also reflected in how cholesterol is measured and reported in a blood test. A standard lipid panel includes total cholesterol, LDL cholesterol (LDL-C), HDL cholesterol (HDL-C), and triglycerides.
Total Cholesterol: Why the Overall Number Is Not Enough
Total cholesterol measures the combined amount of cholesterol carried by different lipoproteins in your blood. This includes cholesterol transported by LDL and HDL, along with other types of lipoproteins. Rather than showing how much cholesterol each type carries, the total cholesterol result brings these amounts together into a single number.
This overall measurement provides a useful starting point, but it has an important limitation. Two people can have the same total cholesterol level even when the cholesterol is distributed differently among their lipoproteins. For example, one person's total may include a larger contribution from LDL, while another person’s may include a larger contribution from HDL. Although their total cholesterol results are identical, the underlying distribution is not.
This distinction matters because different lipoproteins have different roles in the body and different relationships with cardiovascular health. A total cholesterol result cannot show these differences on its own. To understand what contributes to the overall number, it is necessary to look at the individual cholesterol measurements, beginning with LDL cholesterol.
LDL Cholesterol: What It Measures and Why It Matters
Low-density lipoproteins (LDL) carry cholesterol from the liver to other tissues, where it can be used for normal cellular functions. Although this transport serves an essential purpose, LDL particles also play a significant role in cardiovascular disease.
The LDL cholesterol value (LDL-C) on your blood test measures the amount of cholesterol carried by LDL particles. This makes it an important indicator of cardiovascular risk, particularly because LDL particles can enter the walls of arteries, the blood vessels that carry blood away from the heart. Some of these particles can become trapped and contribute to the gradual formation of plaque, a buildup of fatty material and other substances within the artery wall.
Over time, this process, known as atherosclerosis, can narrow arteries and increase the risk of cardiovascular events such as heart attacks and strokes. Research has established that prolonged exposure to elevated LDL cholesterol plays a causal role in the development of this disease. Both the concentration of LDL cholesterol and the duration of exposure therefore matter.
However, LDL-C has an important measurement limitation: it does not reveal how many LDL particles are circulating in the blood. Because individual particles can carry different amounts of cholesterol, similar LDL-C values do not necessarily indicate similar particle numbers. This is one reason LDL-C must be interpreted within a broader cardiovascular context.
While LDL is associated with the development of arterial plaque, HDL has a different role in how the body handles cholesterol.
HDL Cholesterol: Why Higher Is Not Always Better
High-density lipoproteins (HDL) help collect excess cholesterol from cells and tissues, including the walls of arteries, and transport it back toward the liver, where it can be processed and removed from the body. This process helps the body manage cholesterol that is no longer needed in those locations.
The HDL cholesterol value (HDL-C) on your blood test measures the amount of cholesterol carried by HDL particles, but not how effectively those particles remove excess cholesterol from tissues. A higher HDL-C value therefore does not necessarily indicate more efficient cholesterol removal.
HDL-C is often described as “good cholesterol” because lower levels have been associated with a greater risk of cardiovascular disease. However, research has challenged the assumption that higher HDL-C levels always provide greater protection. Clinical trials of medications designed to raise HDL-C have not demonstrated a reduction in cardiovascular events simply from increasing HDL-C levels.
Observational studies have also found that extremely high HDL-C levels can be associated with increased mortality, rather than continued reductions in risk. These findings do not establish that high HDL-C causes harm. They show that the relationship between HDL-C and health outcomes is more complex than the idea that higher is always better.
A high HDL-C result therefore does not cancel out the risks associated with elevated LDL-C or other cardiovascular risk factors. Understanding the broader lipid profile also requires looking at triglycerides, which play a different role in the body and provide additional information about metabolic health.
Triglycerides: What They Tell You About Energy Metabolism
When energy is needed, triglycerides can be broken down into fatty acids, which muscles and other tissues use as fuel. Triglycerides can also be stored in body fat, providing an energy reserve that the body can draw on later.
The triglyceride value on your lipid panel measures the concentration of triglycerides circulating in your blood. These fats come from two main sources. After you eat, fats absorbed from food are packaged into particles that transport triglycerides through the bloodstream. The liver also produces triglycerides and releases them into the blood in its own transport particles.
Elevated triglyceride levels can reflect changes in how the body produces and clears fats from the bloodstream. Mild to moderate elevations are often associated with conditions such as insulin resistance, in which the body's cells respond less effectively to insulin, a hormone that helps regulate blood sugar. Elevated triglycerides can also accompany changes in other blood lipids and are associated with increased cardiovascular risk.
At very high levels, however, triglycerides raise a different concern. Severe elevations are linked to an increased risk of acute pancreatitis, a sudden inflammation of the pancreas, an organ involved in digestion and blood sugar regulation. This risk is distinct from the cardiovascular concerns associated with more moderate elevations.
Elevated triglycerides often occur alongside lower HDL-C levels and can affect the accuracy of some methods used to calculate LDL-C. These relationships provide additional context when interpreting the cholesterol measurements alongside triglycerides.
Understanding what each measurement represents is only part of interpreting a lipid panel. The reported numbers also need to be considered in relation to the reference values and clinical categories used to assess them.
Understanding Cholesterol Results and Reference Values
Cholesterol and triglyceride concentrations are commonly expressed in milligrams per deciliter (mg/dL) or millimoles per liter (mmol/L). These units describe the same measurements in different ways, so the numerical values differ depending on which unit your laboratory uses.
The meaning of those numbers also depends on how they are evaluated. A laboratory reference interval describes a range established using results from a selected group of people for comparison. A clinical risk or decision threshold is different: it identifies a level associated with a particular health risk or one that may influence medical evaluation. An individualized treatment goal, meanwhile, is a target established according to a person's health circumstances and cardiovascular risk. These three concepts serve different purposes and should not be treated as interchangeable.
The following table presents commonly used adult classifications for total cholesterol, LDL-C, HDL-C, and triglycerides, with values expressed in both measurement units.
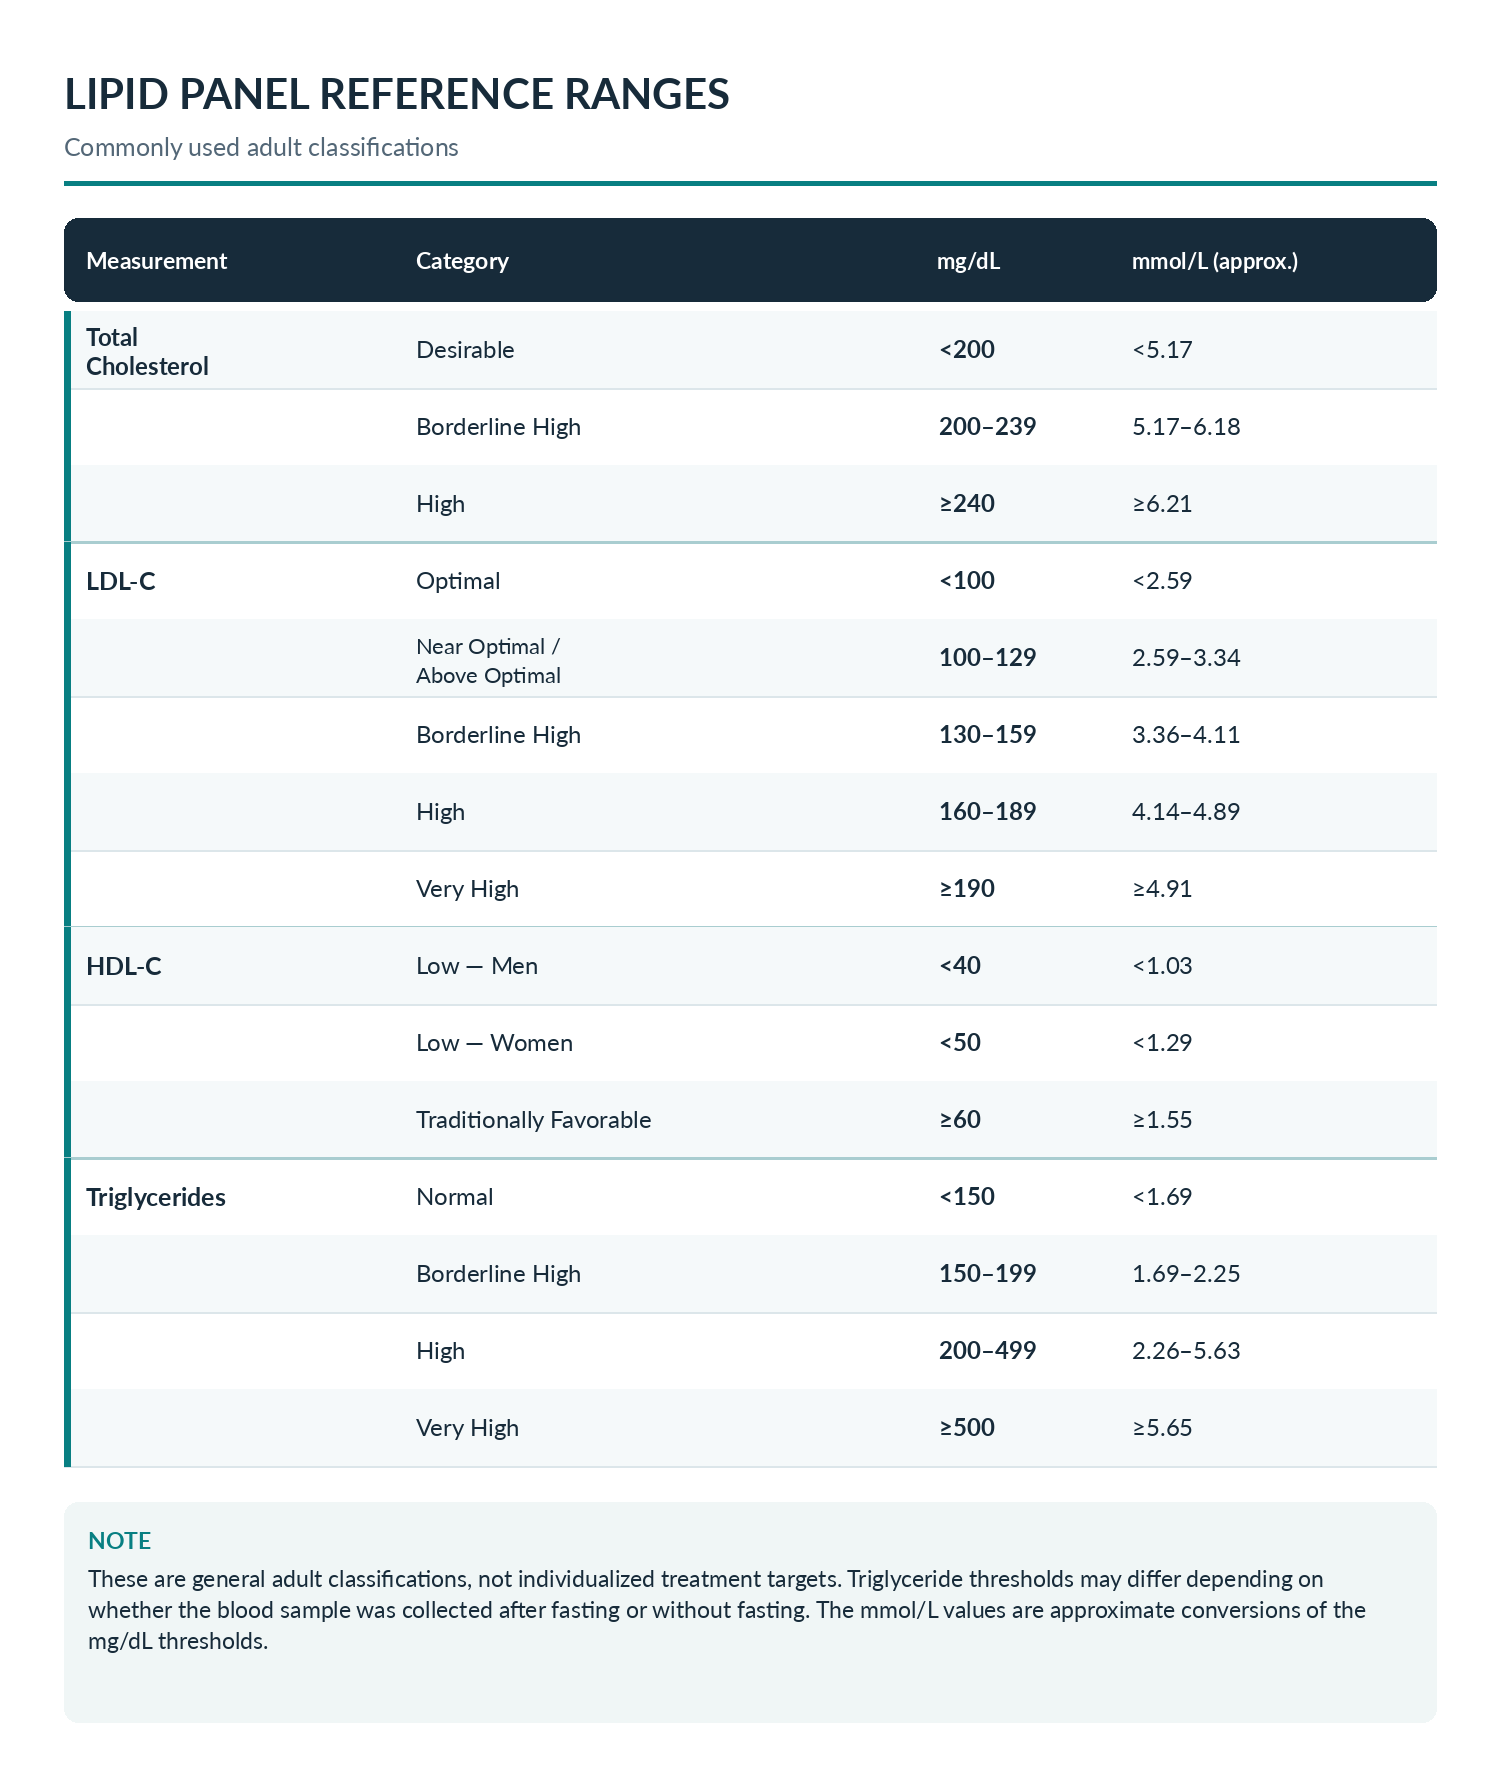
A total cholesterol result labeled Desirable does not reveal how cholesterol is distributed among different lipoproteins. LDL-C categories, on the other hand, are more directly related to cardiovascular risk because of LDL's role in arterial plaque formation. HDL-C uses different criteria: low values are associated with increased cardiovascular risk, while the traditionally favorable category does not mean that higher levels always provide greater protection. Triglyceride classifications address increasing concentrations, with very high levels carrying a distinct risk of pancreatitis.
Terms such as Desirable, Optimal, and Normal describe how a result fits within a general classification. They do not establish a diagnosis or guarantee good cardiovascular health. Similarly, a result classified as high does not, on its own, establish the presence or severity of a medical condition.
The clinical significance of a lipid result also depends on individual circumstances, including age, cardiovascular disease history, diabetes, and other risk factors. For example, an LDL-C concentration considered optimal under a general adult classification may still exceed the treatment goal established for someone with existing cardiovascular disease. The same numerical result can therefore have different implications for different individuals.
Beyond individual health circumstances, the reported lipid values themselves can also change.
Why Lipid Results Can Change
Lipid levels are influenced by several factors, and changes in blood test results do not always have the same explanation. Some reflect changes in how the body produces, transports, or removes fats from the bloodstream. Others arise from the conditions under which blood is collected or from the methods laboratories use to determine the reported values.
Factors That Affect Lipid Levels
Diet can influence cholesterol and triglycerides in different ways. Diets high in saturated fats can increase LDL-C by reducing the liver's ability to remove LDL particles from circulation. In contrast, consuming large amounts of added sugars and refined carbohydrates can increase triglyceride production in the liver. Alcohol consumption can also raise triglyceride levels, while regular physical activity helps the body clear triglyceride-rich particles from the bloodstream and may increase HDL-C.
Metabolic and medical conditions can also affect lipid concentrations. Insulin resistance and type 2 diabetes are often associated with elevated triglycerides and lower HDL-C levels. An underactive thyroid can increase LDL-C because the liver removes LDL particles less efficiently. Certain kidney and liver conditions can alter lipid production or clearance, while inherited differences can influence cholesterol or triglyceride levels throughout life.
Lipid levels may also change with age, hormonal shifts, and the use of certain medications. For example, LDL-C can increase after menopause, while medications such as corticosteroids, which are used to reduce inflammation, and certain diuretics, which help the body remove excess fluid, can affect cholesterol or triglyceride concentrations. Acute illnesses can temporarily change lipid levels, so results obtained during illness may differ from those measured under usual health conditions.
How Testing Conditions Influence Results
The timing of a blood test in relation to meals can affect the reported values, particularly triglycerides. After eating, fats absorbed from food enter the bloodstream and can temporarily increase triglyceride concentrations. This is why laboratories may distinguish between fasting samples, collected after a period without food, and non-fasting samples, collected without that restriction.
Although fasting was traditionally required for cholesterol testing, non-fasting samples are now considered suitable for most routine lipid assessments. Total cholesterol and HDL-C generally change little after an ordinary meal, while triglycerides tend to rise modestly. Fasting samples may still be useful in specific circumstances, particularly when triglycerides are markedly elevated or when another test requires fasting.
Beyond the conditions under which blood is collected, the way laboratories determine lipid values can also influence the reported results. Total cholesterol, HDL-C, and triglycerides are commonly measured directly from the blood sample. LDL-C, however, is often calculated using the other measured values rather than determined through a separate direct measurement. Because these calculations rely partly on triglyceride concentrations, elevated triglycerides can reduce the accuracy of certain LDL-C estimates. Different calculation methods may also produce somewhat different results.
Because each lipid measurement responds differently to physiological and testing conditions, the relationships among the four results can offer additional context when interpreting a lipid panel.
Why the Four Results Need to Be Read Together
Consider two illustrative lipid profiles with identical total cholesterol readings of 210 mg/dL but different results for the other measurements.
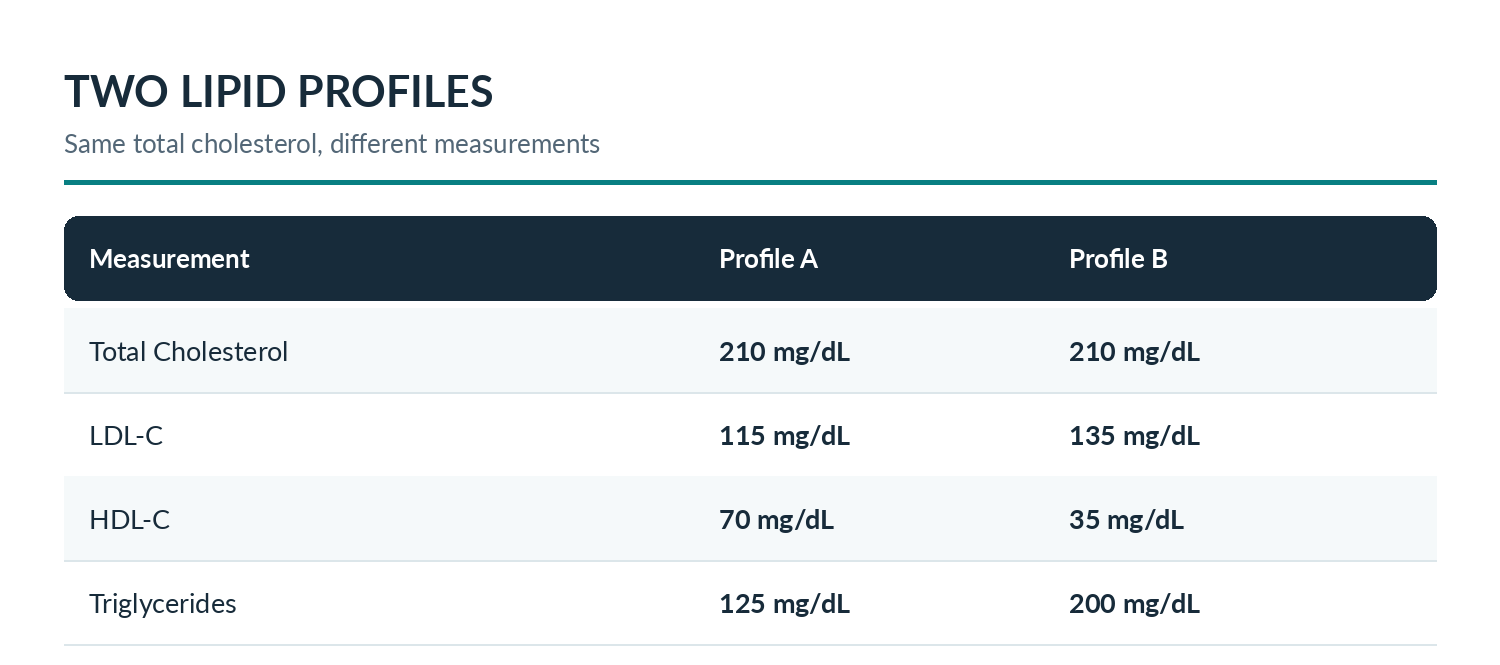
Profile A has lower LDL-C and triglycerides, alongside higher HDL-C. Profile B has higher LDL-C and triglycerides, with lower HDL-C. These examples do not establish either person's cardiovascular health or overall risk. They illustrate why the total cholesterol number alone cannot describe the full lipid profile.
The relationships between individual measurements can also provide useful information. Elevated triglycerides often occur alongside lower HDL-C levels, particularly in people with insulin resistance. This combination may point toward broader metabolic changes, although it cannot establish insulin resistance or another condition on its own.
Another measurement that can add context is non-HDL cholesterol (non-HDL-C). It is calculated by subtracting HDL-C from total cholesterol and represents the cholesterol carried by LDL and other particles that can contribute to plaque formation in arteries. Unlike total cholesterol, non-HDL-C excludes cholesterol carried by HDL particles. However, non-HDL-C does not directly measure the number of those particles.
Lipid results can also be considered alongside other blood measurements. HbA1c reflects average blood sugar levels over approximately the previous two to three months, while fasting glucose measures blood sugar at a particular point after a period without food. Considering these measurements alongside triglycerides and HDL-C can help reveal related metabolic patterns that may not be apparent from either panel alone. For further explanation of these measurements, see Saluso's articles HbA1c: What Your Longer-Term Blood Sugar Average Really Shows and Understanding Fasting Glucose: What the Test Measures and How to Interpret It.
Even when all four lipid measurements are considered together, a standard lipid panel cannot capture every aspect of cardiovascular health. It does not directly measure the number or function of lipoprotein particles, identify plaque already present in arteries, or account for factors such as blood pressure, smoking, and medical history. These limitations reinforce the importance of broader clinical context. Previous lipid panel results can add another perspective by showing how the measurements have changed over time.
Looking at Your Cholesterol Results Over Time
Comparing lipid panel results from different dates can reveal whether cholesterol and triglyceride levels have remained relatively stable, gradually shifted, or changed more noticeably. Recognizing these patterns requires looking beyond the individual numbers reported at each test.
Some variation is a normal part of how the body functions. Even when a person's health and daily habits remain relatively consistent, lipid concentrations can fluctuate around their usual levels. This is known as biological variation, and it differs among the four measurements. Triglycerides, in particular, tend to fluctuate more than cholesterol measurements. As a result, a difference between two test results does not necessarily indicate a meaningful change in cardiovascular or metabolic health.
Comparing results across time also requires attention to testing conditions. Differences in fasting status, whether a sample was collected during an illness, or the laboratory method used to calculate LDL-C can affect how comparable two results are. Considering these conditions alongside normal biological variation helps determine whether an apparent difference may reflect a persistent change or ordinary fluctuations.
A meaningful trend is not defined by a single higher or lower reading, but by how results change across measurements and whether those changes are consistent with the person's broader health circumstances.
Keeping laboratory reports organized makes it easier to revisit previous measurements and observe trends. Saluso brings health records together in one place, helping users compare past results, follow changes over time, and prepare more informed conversations with healthcare professionals. These tools support a clearer understanding of personal health information without replacing professional medical evaluation.
Get the Saluso newsletter
Health guides and product news, about twice a month. Unsubscribe anytime.